Quarterly Tenant Satisfaction Measures (TSMs)
We report on our Tenant Satisfaction Measures (TSMs) both annually and every three months (quarterly). You can read our annual TSMs by clicking the button below, or see our quarterly ones on this page. To get these quarterly TSM results, we survey residents every month using the same Tenant Perception (TP) questions we use for our annual TSM results.
The image below covers the 12 TSMs known as Tenant Perception (TP) measures, as well as additional performance information.
The current reported performance is impacted by small sample sizes. This is due to only being in quarter one of the year. Surveys will continue through the year and increase this sample size to increase representation in the data.
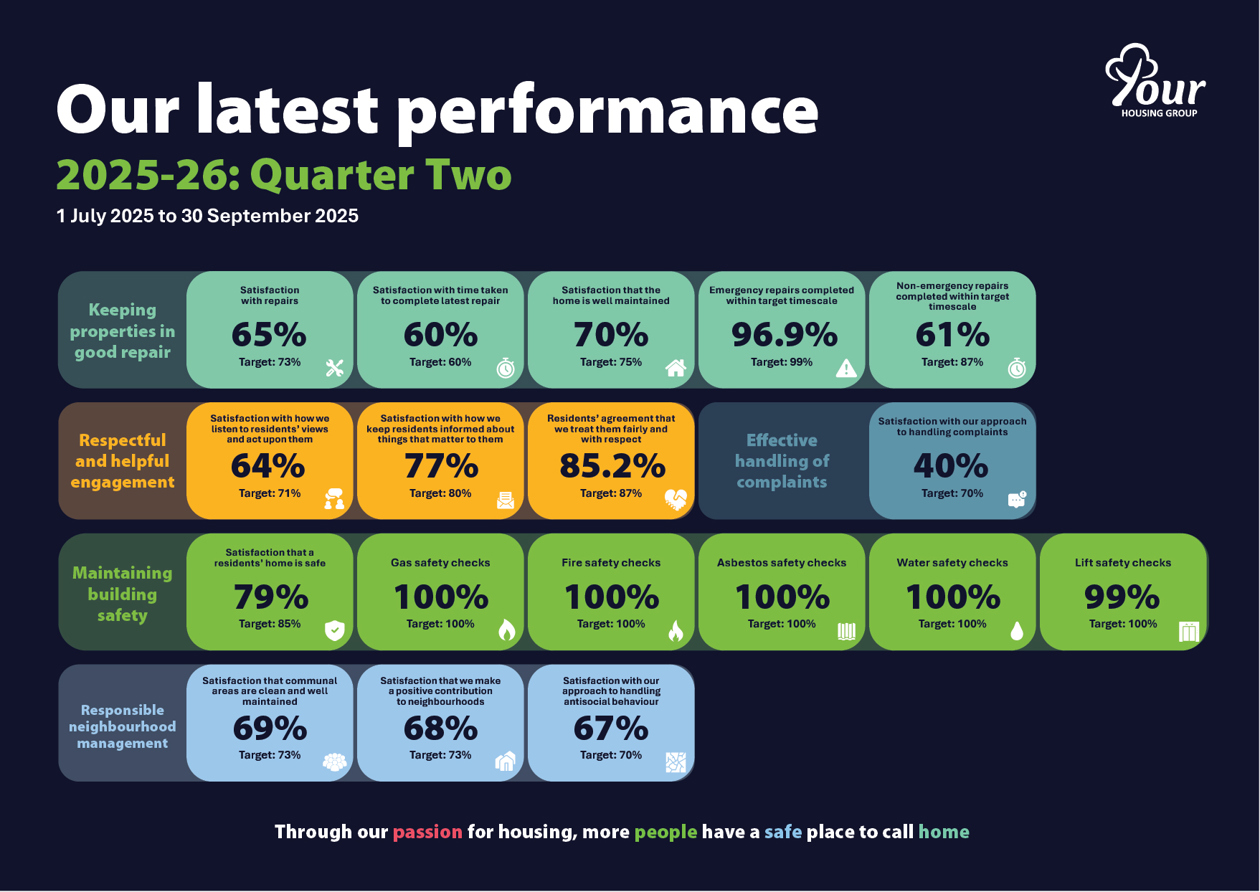
The 12 Tenant Perception measures are all the results of your feedback, views and thoughts on our current service and provision, and the extra information is based on our own standards of performance.
If you would like to view this information offline, or save it for later, please click on the pink 'download now' button below.
Previous results
The TSMs listed below are reported annually and will be updated in July each year.
- Proportion of homes that do not meet the Decent Homes Standard (%)
- Number of ASB cases opened (per 1,000 homes)
- Number of ASB cases that involve hate incidents opened (per 1,000 homes)
- Number of stage one complaints received (per 1,000 homes)
- Number of stage two complaints received (per 1,000 homes)
- Proportion of stage one complaints responded to within the Housing Ombudsman's Complaint Handling Code Timescales (%)
- Proportion of stage two complaints responded to within the Housing Ombudsman's Complaint Handling Code Timescales (%)
Please click here to see last year's position.
Low Cost Rental Accommodation
The TSMs above refer only to our Low Cost Rental Accommodation (LCRA), which are homes that are let at social or affordable rent. We report on our LCRA TSMs every three months as these form the majority of our homes.
However, in our annual TSMs, we also include our Low Cost Home Ownership (LCHO) homes. These are shared ownership homes.